 R package arulesViz - Visualizing Association Rules and Frequent Itemsets
Introduction
This R package extends package arules with various visualization techniques for association rules and itemsets. The package also includes several interactive visualizations for rule exploration.
The following R packages use arulesViz:
arules,
fdm2id,
rattle,
TELP
To cite package ‘arulesViz’ in publications use:
Hahsler M (2017). “arulesViz: Interactive Visualization of Association Rules with R.” R Journal, 9(2), 163-175. ISSN 2073-4859, <doi:10.32614/RJ-2017-047> https://doi.org/10.32614/RJ-2017-047, https://journal.r-project.org/archive/2017/RJ-2017-047/RJ-2017-047.pdf.
@Article{,
  title = {arules{V}iz: {I}nteractive Visualization of Association Rules with {R}},
  author = {Michael Hahsler},
  year = {2017},
  journal = {R Journal},
  volume = {9},
  number = {2},
  pages = {163--175},
  url = {https://journal.r-project.org/archive/2017/RJ-2017-047/RJ-2017-047.pdf},
  doi = {10.32614/RJ-2017-047},
  month = {December},
  issn = {2073-4859},
}
This might also require the development version of arules.
Features
- Visualizations using engines
ggplot2(default engine for most methods),grid,base(R base plots),htmlwidget(powered byplotlyandvisNetwork). - Interactive visualizations using
grid,plotlyandvisNetwork. - Interactive rule inspection with
datatable. - Integrated interactive rule exploration using
ruleExplorer.
Available Visualizations
- Scatterplot, two-key plot
- Matrix and matrix 3D visualization
- Grouped matrix-based visualization
- Several graph-based visualizations
- Doubledecker and mosaic plots
- Parallel Coordinate plot
Installation
Stable CRAN version: Install from within R with
install.packages("arulesViz")
Current development version: Install from r-universe.
install.packages("arulesViz",
    repos = c("https://mhahsler.r-universe.dev". "https://cloud.r-project.org/"))
Usage
Mine some rules.
library("arulesViz")
data("Groceries")
rules <- apriori(Groceries, parameter = list(support = 0.005, confidence = 0.5))
## Apriori
##
## Parameter specification:
##  confidence minval smax arem  aval originalSupport maxtime support minlen
##         0.5    0.1    1 none FALSE            TRUE       5   0.005      1
##  maxlen target  ext
##      10  rules TRUE
##
## Algorithmic control:
##  filter tree heap memopt load sort verbose
##     0.1 TRUE TRUE  FALSE TRUE    2    TRUE
##
## Absolute minimum support count: 49
##
## set item appearances ...[0 item(s)] done [0.00s].
## set transactions ...[169 item(s), 9835 transaction(s)] done [0.00s].
## sorting and recoding items ... [120 item(s)] done [0.00s].
## creating transaction tree ... done [0.00s].
## checking subsets of size 1 2 3 4 done [0.00s].
## writing ... [120 rule(s)] done [0.00s].
## creating S4 object  ... done [0.00s].
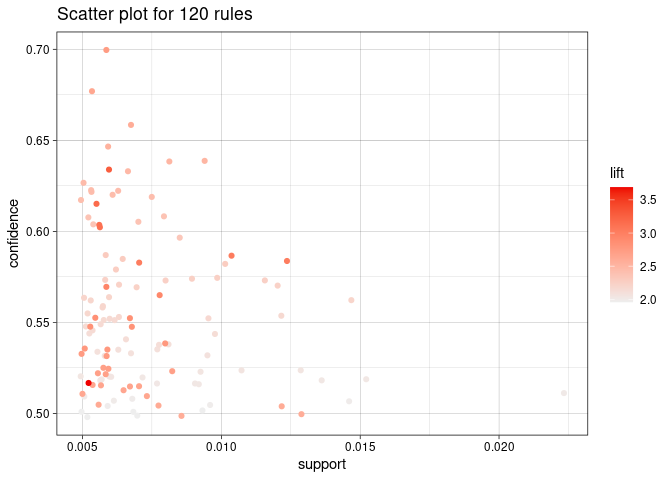
Standard visualizations
plot(rules)
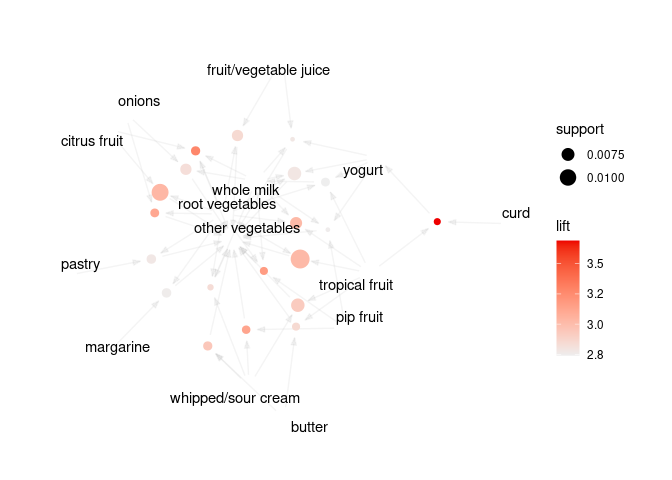
plot(rules, method = "graph", limit = 20)
Interactive visualization
Live examples for interactive visualizations can be seen in Chapter 5 of An R Companion for Introduction to Data Mining
References
- Michael Hahsler. arulesViz: Interactive visualization of association rules with R. R Journal, 9(2):163-175, December 2017.
- Michael Hahsler. An R Companion for Introduction to Data Mining: Chapter 5. Online Book. https://mhahsler.github.io/Introduction_to_Data_Mining_R_Examples/book/, 2021.
- Michael Hahsler, Sudheer Chelluboina, Kurt Hornik, and Christian Buchta. The arules R-package ecosystem: Analyzing interesting patterns from large transaction datasets. Journal of Machine Learning Research, 12:1977-1981, 2011.
- Michael Hahsler and Sudheer Chelluboina. Visualizing Association Rules: Introduction to the R-extension Package arulesViz (with complete examples).